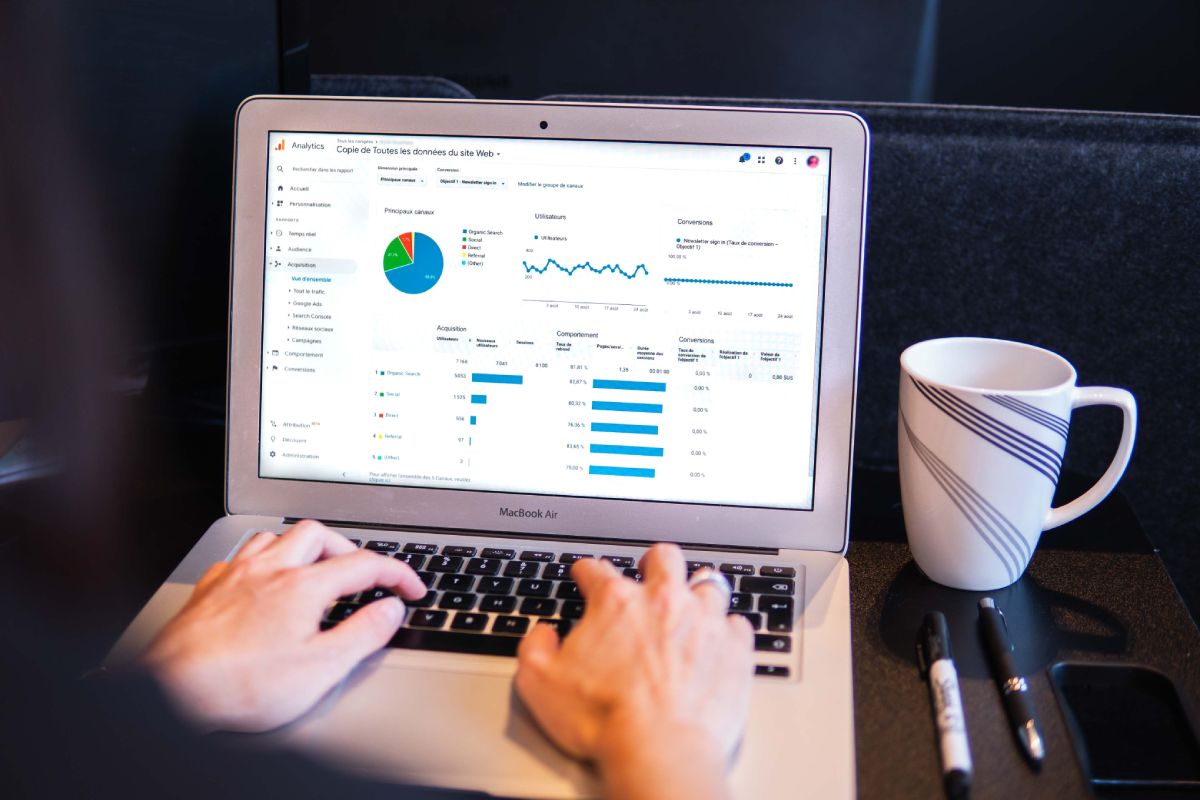
Customer analytics are an integral part of every company’s operational and marketing initiatives. The information you get from consumers may be quite valuable for helping you develop your business.
With the vast amount of data generated by a typical business’s day-to-day activities, having a clear plan for gathering, collecting, filtering, and evaluating the relevant customer data for your unique goals and needs is critical.
You may utilize this data to better your business operations, customer journeys, and predictive analytics, but only if you discover the exact information you want.
Here, in this post, we will learn all about customer analytics; how to use it and why it is important for your business.
Table of Contents
Customer analytics relates to the procedures and techniques used to provide enterprises with customer insight, which are mostly connected to big data analytics— these aid in the timely delivery of anticipated and appropriate outcomes.
Customer analytics includes predictive customer analytics, data visualization, customer journey analytics, information management, and segmentation and serves as the backbone for all marketing efforts.
The Customer analytics helps categorize your data to get to your target audience’s requirements, objectives, and pain points. It may also assist you in identifying new audiences who would be interested in your products and content.
There are usually four types of customer analytics categories; you should gather data from each of these categories to have a more profound knowledge of your customers’ concerns and potential.
Attitudinal: Surveys, focus groups, and usability tests are commonly used to collect preference data, views, desirability, branding, and attitudes. Questionnaires & forms can assess how interactions and behaviors impact attitudes.
Behavioural: Customers’ common tendencies when utilizing your goods and services are as follows- buying goods, registering, browsing, and using various gadgets are all part of it.
Descriptive: This covers information such as gender, age, location, and income. Purchase history, registrations, surveys, interviews, and contextual inquiries are all excellent places to start.
Interaction: This comprises website and program clicks, navigation pathways, and browsing activity. To collect data for this category, you may utilize real-time data from A/B testing, Google Analytics, and lab-based or unmoderated testing.
Business intelligence skills are growing, and companies worldwide are interested in learning more about what it has to offer.
It also has a variety of applications, which is crucial. You want to not only satisfy your clients by meeting their demands and alleviating their pain spots, but you also want to keep your competition at bay. Having a solid customer analytics protocol is a must in today’s industry.
It’s the easiest method to get behind the scenes and capture the customer’s voice. And it should be at the top of every brand’s priority list because if you don’t do it properly, your competitors will.
Customer analytics can help your business in:
Here, we’ll look at five steps you can take to enhance your customer analytic approach so you can enjoy the benefits and grow your business.
It’s crucial to define what you want to achieve before you start gathering data. What challenges with your business or sales are you attempting to resolve? These objectives will guide your analysis and how you transform the data you acquire into helpful information.
Plan which data to gather and how you’ll create and process it with your team. Whether you obtain it via online surveys, online forms, helpdesk tickets, in-store visits, website surfing, or blog comments, combine it all in a single dashboard to get a holistic view of the data trends.
Quantitative data is pre-arranged and may be imported to excel or other model calculators; where it can subsequently be structured by manipulating columns and rows. However, qualitative data, which is typically unstructured text rich in thoughts and views, must be formatted first.
You can conduct comprehensive voice of customer (VoC) analytics with AI technologies to learn more about what consumers think about your brand and undertake prescriptive and predictive studies to forecast responses to promotional activities, product launches, and other events.
When you employ visualization tools with eye-catching graphs and charts to try and compare your results, your data will be better exhibited and understood. Visualization tools for business intelligence allow you to visualize your results in both a broad overview and fine-grained detail.
You can generate a 360-degree perspective of your consumers by conducting both quantitative and qualitative studies on your customer data. When it comes to examining quantitative data, customer analytics solutions like Google Analytics are relatively simple to use.
However, when you start digging into your open-ended comments though; you’ll need more sophisticated technology and skilled specialists to extract insights. And we at SG Analytics can help you with that.
Contact us today to learn more about our customer analytics solutions.
Data analytics has reshaped marketing tactics beyond recognition. In an age where every click, comment,… Read More
Skin resurfacing treatments have advanced significantly, offering more effective and comfortable solutions for achieving smoother,… Read More
Nothing disrupts the immersive experience of Minecraft quite like sudden lag spikes or persistent connection… Read More
Launching a startup is an exciting yet challenging journey, and many founders fall into the… Read More
Workplace stress is a silent epidemic, impacting productivity and morale. Companies have long sought effective… Read More
A well-lit yard enhances your home's curb appeal and significantly improves security. Smart outdoor lighting… Read More